Thursday, November 23, 2006


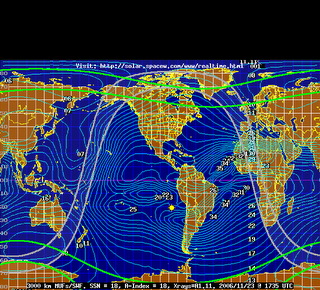
Near-Real-Time MUF map


The following map shows Maximum Usable Frequencies (MUFs) for 3000 kilometer radio signal paths. More importantly, the current sunspot number (SSN) and Planetary A-index are updated every 30 minutes on the bottom of this image. Additionally, the grey line position, auroral ovals, and sun position are provided.

Tuesday, November 21, 2006


Current Solar Images

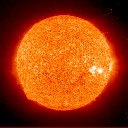
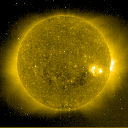
The images above are current views of the sun shown at different wavelengths of light as taken by SOHO and the Yohkoh soft-Xray telescope. Generally, more bright regions on the disk indicates more solar activity, which usually leads to higher solar flux levels (which also often leads to better ham radio and shortwave propagation!).
(Orange= SOHO- 30.4 nm, Yellow= SOHO- 28.4 nm, Green= SOHO- 19.5 nm, Blue= SOHO- 17.1 nm)

Friday, November 17, 2006


This is a map showing the altitude where the electron density reaches a maximum (known as an hmF2 map, or the height maximum of the F2 layer). The contours are labelled in km above the surface of the Earth. Higher F2-layer maximums can result in propagation to much greater distances than the single-hop limit of about 4,000 km. This information is superimposed on an oblique azimuthal equidistant map projection (described below).

This type of map projection is extremely useful for instantly determining the great-circle bearings to distant regions of the world. It is valid for locations near geographic 40N 100W. The great-circle bearing from 40N 100W to any other location in the world can be determined simply by following one of the azimuthal "spokes" to the destination. For example, the great-circle azimuth to the southern tip of South Africa lies at an azimuth of about 103 degrees (measured from the north). The azimuth to Australia is much less sensitive. Transmissions using azimuths between about 250 and 290 degrees will reach Australia provided the signal does not deviate from the great-circle path. In reality, some deviation is almost certain. The extent of the deviation can only be determined through three-dimensional ray-tracing.

Thursday, November 16, 2006


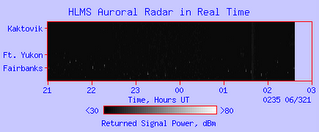
Real-Time Plot of Auroral Radar Returns at VHF

The University of Alaska, Geophysical Institute, Poker Flat Research Range conducts extensive research involving all aspects of the polar regions. The following plot is generated in real-time and represents conditions as they exist at this instant (graphic plot is updated every minute). The plot is based on aurora radar returns operating at 50 MHz in Anchorage, Alaska and is used here with permission. You can learn much more about the High Latitude Monitoring Station operated by the University of Alaska. Bands of white echo returns in the chart indicate that the radio aurora is returning VHF radio signal echoes in Alaska.

Wednesday, November 15, 2006


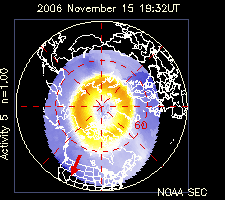
Auroral Activity
Aurora (also known as "aurora borealis" or "northern lights") is caused by interaction between the Earth's magnetic field and the solar wind (a mix of charged particles blowing away from the sun). During solar storms, enough of these charged particles make it through to the Earth's upper atmosphere that they interact with the earths natural magnetic field lines. When enough of these particles collide, energy is released in the form of auroral light. In addition to creating a pretty light show (mostly in upper latitudes), radio signals scatter off of these particles and can greatly enhance propagation on 6 meters and above. High levels of aurora can also make HF propagation via polar routes difficult.

Tuesday, November 14, 2006


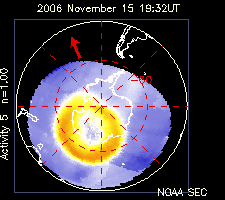
This plot estimates the VISIBILITY of auroral activity from any location in the northern hemisphere, assuming a dark moonless sky and low light pollution. It is updated every 5 minutes with the latest solar wind data(Link to updated info is provided in the link section to the right). The model computes the estimated brightness of auroral activity and plots this on the map as a solid bright color that varies from green (NIL to low levels of auroral activity) to brown/orange (low to moderate levels of activity) to red (moderate to high levels of activity). The brighter the red, the more intense the activity. Those areas which may be able to spot activity are most often within the zone of fading color on the outskirts of the plotted auroral oval. The extent of the fading color zone on the outskirts of the oval is based on the estimated height and intensity of auroral luminosity.
Use this chart to quickly determine whether auroral activity might be visible from your location and what intensity the activity might be. The image is created using a model that computes the potential auroral luminosity from current solar wind conditions. It has been verified for accuracy using historic POLAR spacecraft data. Although the model works very well and should provide visual observers with a good estimate of the visibility of auroral activity, it is not perfect and may occasionally under or overestimate the visibility of activity from some regions. This is due to the unpredictable nature of auroral substorm activity.

Friday, November 10, 2006

  • Radiowave Propagation in the Medium and High Frequency Spectrum
    Definitions
    Radiowave propagation
    Medium Frequency 300-3,000kHz (300kHz-3MHz)
    High Frequency 3,000-30,000kHz (3MHz-30MHz)
    Ground Waves
    TX
    RX
    Direct wave
    Reflected Wave
    Ground Figure 1 The Situation at VHF
    But at HF
    The last term is the surface wave.
    Ground Wave = Direct Wave + Reflected Wave + Surface Wave
    At MF and in the lower HF bands, aerials tend to be close to the ground (in terms of wavelength). Hence the direct wave and reflected wave tend to cancel each other out (there is a 180 degree phase shift on reflection). This means that only the surface wave remains.
    So what is a surface wave? It’s a wave that travels along the surface of the earth by virtue of inducing currents in the earth. The imperfectly conducting earth leads to some of its characteristics. Its range depends upon:
    Frequency
    Polarisation
    Location
    Vertical line represents wavefrontGround conductivity.
    Vertical line represents wavefront Figure 2 Surface Waves Tilt
    So the surface wave dies more quickly as the frequency increases. Conversely at very low frequencies, the tilt angle can equal the curvature of the earth and the surface wave will travel for very long distances indeed.
    The range for surface waves is approximately described by:

    Frequency (MHz) Range(Miles)
    1.8--------------------- 93
    3.5 ---------------------67
    7 -----------------------47
    14 --------------------- 33
    21 --------------------- 27
    28 ---------------------23'
This table is for vertically polarised surface waves. Horizontally polarised surface waves are heavily attenuated and don’t go far at all. The table is just a rough idea. What you will achieve depends upon your system.
What use are Surface Waves?
They are very stable – no fading or phase distortion
They are very predictable
They are the way we receive medium wave signals during the daytime
They are what we use on topband (160m or 1.8MHz) for mobile operation during the day

Exercise

1. Using a standard medium wave receiver tune around between 1200 and 1300 listening for a relatively weak but stable station (try a local radio station about 50-70 miles away). Listen to it at 1200 or 1300 to identify it; they usually identify on the hour. Note its signal strength, quality, is it distorted or not, using the SINFO method on the attached sheet. You can now turn the receiver off but leave it tuned to this station.

2. At 2100 turn on your receiver and listen to the same frequency. Can you still hear the station? If so, how does it compare to the signal at 1200? Is it stronger or weaker, is the signal stable or fading, is it clear or sometimes distorted. If you can’t hear the same station, note why not. Was it due to interference? How does the interference sound? Use the SINFO method for recording the signal again.

Questions to think about
Do medium wave stations use vertical or horizontal aerials?
How far do you think that you could expect to get in the daytime with a topband mobile?
What differences in results would you expect between topband mobile and VHF mobile during the day?
If you listen on 40m during the day you can hear signals from all round Europe. Are these surface waves?
The SINPO Code

The SINPO code is a way of quantifying reception conditions in a five-digit code, especially for use in reception reports to broadcasters. The code covers Signal strength, Interference (from other stations), Noise (from atmospheric conditions), Propagation disturbance (or Fading, in the SINFO code), and Overall. The code is as follows:
(S)ignal (I)nterference (N)oise (P)ropagation (O)verall 5 excellent 5 none 5 none 5 none 5 excellent 4 good 4 slight 4 slight 4 slight 4 good 3 fair 3 moderate 3 moderate 3 moderate 3 fair 2 poor 2 severe 2 severe 2 severe 2 poor 1 barely aud. 1 extreme 1 extreme 1 extreme 1 unusable

In recent years, many broadcasters have tried to steer listeners away from the SINPO code and toward the simpler SIO code. SIO deletes the extremes (1 and 5) and the noise and propagation categories, which were confusing to too many people to be useful. In sending reports to stations other than large international broadcasters who are likely to understand the codes, it is better to simply describe reception conditions in words.
Some Further Thoughts
Surface Waves over a perfectly conducting plane surface would be vertically polarised and reduce in strength by 6dB with each doubling of the distance from the transmitter. If the perfectly conducting plane was removed, the signal strength at the receiver would be unaltered as the direct wave would remain (it would no longer be cancelled out by ground reflections) Then the polarisation would not matter and vertical or horizontal polarisation would work equally well.
A very famous antenna called the Beverage makes use of the effects of an imperfect earth and responds to the low level but nearly horizontal waves that exist close to the ground. The Beverage is a very long wire aerial (several wavelengths long). Hence, Beverage aerials tend to need to be low and often work best where ground conductivity is low.

Thursday, November 09, 2006


Last major update issued on November 9, 2006 at 05:15 UTC.
[Solar and geomagnetic data - last month (updated daily)][Solar wind and electron fluence charts (updated daily)][Solar cycles 21-23 (last update October 2, 2006)][Solar cycles 1-20][Graphical comparison of cycles 21, 22 and 23 (last update October 2, 2006)][Graphical comparison of cycles 2, 10, 13, 17, 20 and 23 (last update October 2, 2006)][Historical solar and geomagnetic data charts 1954-2005 (last update March 3, 2006)][Archived reports (last update October 2, 2006)]
Recent activity
The geomagnetic field was inactive to very quiet on November 8. Solar wind speed ranged between 274 and 311 km/s (all day average 293 km/s - decreasing 1 km/s from the previous day).
Solar flux measured at 20h UTC on 2.8 GHz was 86.4. The planetary A index was 1 (STAR Ap - based on the mean of three hour interval ap indices: 0.9). Three hour interval K indices: 00001000 (planetary), 00002000 (Boulder).
The background x-ray flux is at the class B1 level.
At midnight there were 2 spotted regions on the visible solar disk. The solar flare activity level was very low. No C class events were recorded during the day.
Region 10921 decayed slowly and quietly.New region 10923 rotated into view late on November 7 and was numbered the next day by NOAA/SEC. The region must have decayed over the last few days as it is now fairly quiet and spotwise not that complex. C flares are possible.
Coronal mass ejections (CMEs)
November 6-8: No obvious partly or fully Earth directed CMEs were detected in LASCO imagery.

Propagation Catagories

Free Space Propagation; Here the radio signals travel in free space, or away from other objects which influence the way in which they travel. It is only the distance from the source which affects the way in which the field strength reduces. This type of radio propagation is encountered with signals travelling to and from satellights.

Ground Wave Propagation; When signals travel via the ground wave thay are modified by the ground or terrian over which they travel. They also tend to follow the earth's curvature. Signals heard on the medium wave band during the day use this form of propagation.


Ionospheric Propagation; Here the radio signals are modified and influenced by the action of the free electrons in upper reaches of the earth's atmosphere called the Ionosphere. This form of radio propagation is used by stations on the short wave bands for their signals to be heard around the globe.

Tropospheric Propagation; Here the signals are influenced by the variations of refractive index in the troposphere just above the earth's surface. Tropospheric radio propagation is often the means by which signals at VHF and above are heard over extended distances.


There are many radio propagation scenarios in real life. Often signals may travel by several means, signals travelling using one type of propagation interacting with another. However to build up an understanding of how a signal reaches a reciever, it is necessary to have a good understanding of all the possible methods. By understanding these, the interactions can be better understood.
Radio waves, like light waves and all other forms of electromagnetic radiation, normally travel in straight lines. Obviously this does not happen all the time, because long - distance communication depends on radio waves traveling beyond the horizon. How radio waves propagate in other than straight-line paths is a complicated subject, but one that need not be a mystery. This page provides basic understanding of the principles of electromagnetic radiation, the structure of the Earth's atmosphere and solar-terrestrial interactions necessary for a working knowledge of radio propagation. More detailed discussions and the underlying mathematics of radio propagation physics can be found in the references listed under additional resources.
The Sun, being the largest engine in our solar system, has a great effect on propagation as its "exhaust" interacts with our Earth's magnetic field. A rudimentary knowledge of sunspots, solar flares and mass ejections will help the amateur take advantage of these effects to enhance his pleasure, or understand his plight. A good basic understanding of this can be had by reading the article "The Sun, the Earth, the Ionosphere. See also the list of other articles on propagation.