Last major update issued on November 9, 2006 at 05:15 UTC.
[Solar and geomagnetic data - last month (updated daily)][Solar wind and electron fluence charts (updated daily)][Solar cycles 21-23 (last update October 2, 2006)][Solar cycles 1-20][Graphical comparison of cycles 21, 22 and 23 (last update October 2, 2006)][Graphical comparison of cycles 2, 10, 13, 17, 20 and 23 (last update October 2, 2006)][Historical solar and geomagnetic data charts 1954-2005 (last update March 3, 2006)][Archived reports (last update October 2, 2006)]
Recent activity
The geomagnetic field was inactive to very quiet on November 8. Solar wind speed ranged between 274 and 311 km/s (all day average 293 km/s - decreasing 1 km/s from the previous day).
Solar flux measured at 20h UTC on 2.8 GHz was 86.4. The planetary A index was 1 (STAR Ap - based on the mean of three hour interval ap indices: 0.9). Three hour interval K indices: 00001000 (planetary), 00002000 (Boulder).
The background x-ray flux is at the class B1 level.
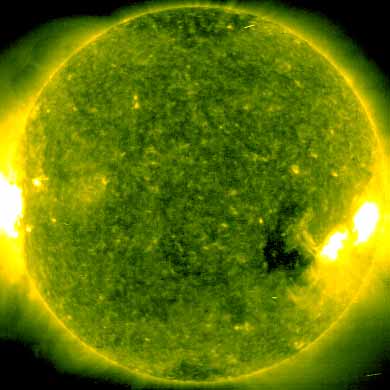
At midnight there were 2 spotted regions on the visible solar disk. The solar flare activity level was very low. No C class events were recorded during the day.
Region 10921 decayed slowly and quietly.New region 10923 rotated into view late on November 7 and was numbered the next day by NOAA/SEC. The region must have decayed over the last few days as it is now fairly quiet and spotwise not that complex. C flares are possible.
Coronal mass ejections (CMEs)
November 6-8: No obvious partly or fully Earth directed CMEs were detected in LASCO imagery.
posted by World Radio Club at 8:04 PM
![]()

0 Comments:
Post a Comment
<< Home